(This is Part 2 of a 2-part series the embarks on The Learning Brain and the Discovery to optimize learning customization and engagement for each Student)
What if we could better understand what goes inside students’ heads, literally, while they undergo learning experiences and environments?
What if we could truly know when students achieve peak performance, when their engagement is at its highest, and when their interest is maximized? What were they doing? What happened in those moments?
What if we could ‘see’ what they are sensing and feeling? And what if we could use that information to design better and more sensible learning environments?
In Part 1 we introduced a summary of what we now know, from a strong body of research about neuroscience and learning as it relates to learning space.
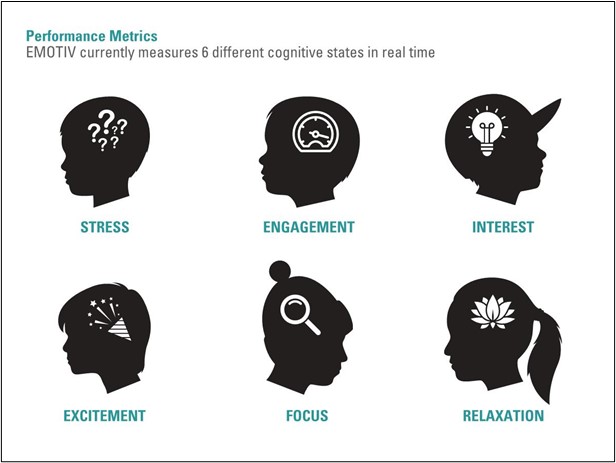
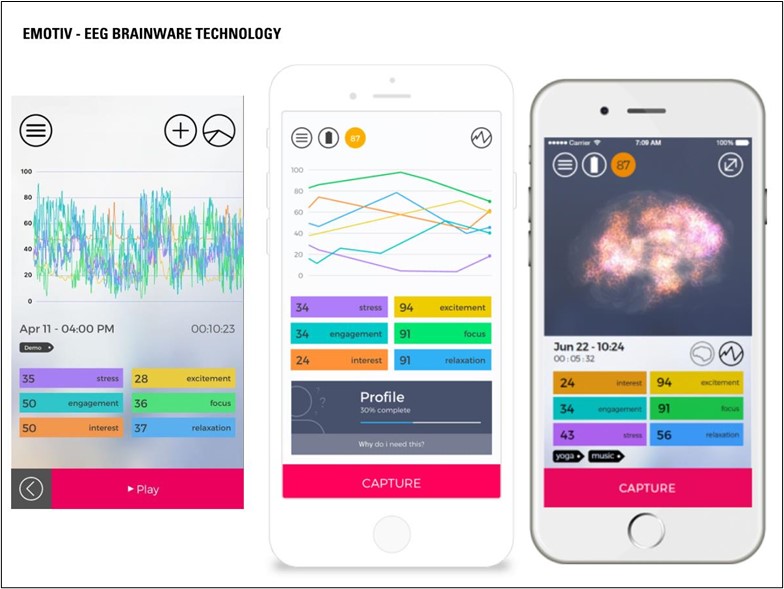
In Part 2 we are sharing primary research conducted with a partner school where we set to ‘see’ inside high school students’ brains as they perform various activities such as passively listening in a class, taking a test, dialoguing with professors in a seminar, collaboratively working with a team on a competitive quiz, processing info during a lab, or while doing experimentation. Using a Whole Brain Sensing via Brainwear Wireless EEG (Electro-Encephalogram) Technology we found some answers to these questions. Through this groundbreaking Technology we could see what happens to their emotions (6 of them: Engagement, Interest, Stress, Focus, Excitement and Relaxation) as they experience various the typical, aforementioned learning ‘moments’.
WHAT WE DISCOVERED
We are sharing interesting observations and findings from our research about the Learning Brain. We tried to find answers to a few of the most important questions of our time regarding customization of learning to each and every child: when is a child engaged? what interests them? What excites them? Does something or somewhere trigger that engagement?
Our methodology was broken into the following elements:
The WHY: Student Engagement is the name of the game in Education. If we could measure when students are most engaged, we could impact education. We are also trying to better understand when students are excited, or stressed, or focused, or relaxed. What triggers these internal moods? As designers of Learning Spaces, we are researching the link between space, learning, wellness and neuroscience.
The WHAT: we are trying to measure Engagement, Excitement, Interest, Focus, Stress, and relaxation during various learning experiences
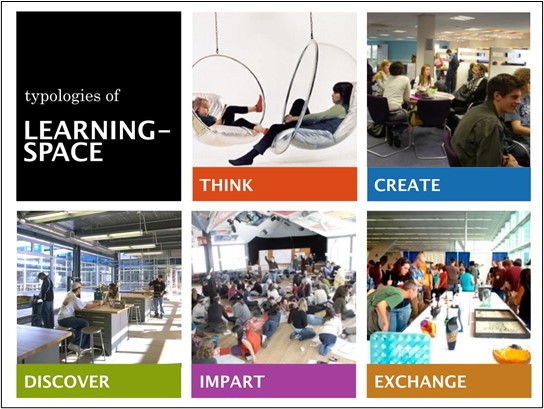
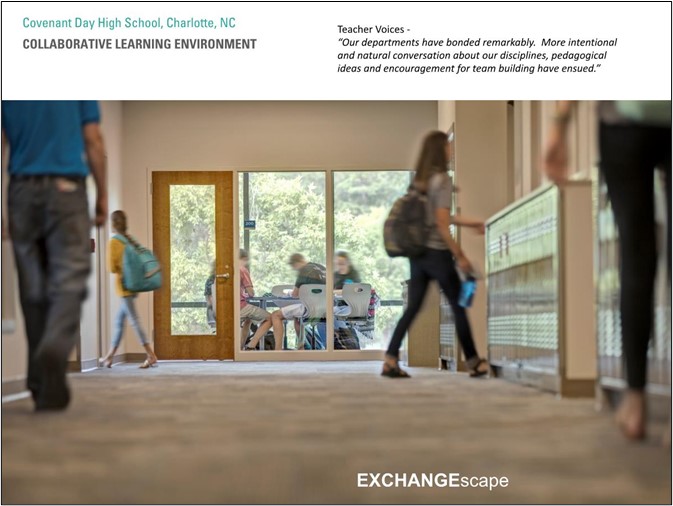
The WHERE: we partnered with Covenant Day High School in Charlotte, NC. The Immersive Learningscape Concept was the bases for the setting. A concept that highlights a landscape of various learning environments that address what we see as 5 typologies of learning: Think, Create, Discover, Impart, and Exchange. Each of these typologies requires very specific needs (space, technologies, furniture, acoustics, etc…) in order to be effective for today’s students’ learning process. These typologies also support the process of innovation from the ‘seed’ stages where small environments may be needed, to implementation spaces where large areas are required for assembly of innovative ideas.
The following images show the essence, feel and culture of the school, and the setting for the research:
4. The HOW:
Subjects — 4 different students were part of the project. The goals of this specific project were to observe measurements. (In a future project, and to create a more robust data collection and analysis 6 students simultaneously wearing devices would be measured to achieve a comprehensive study with correlated data to learn patterns and offer recommendations)
Time — Students wore the devices during one class period in various courses: AP Latin, AP Physics, an AP Biology Lab. (In a future project, additional 1 week-long research measurement projects will be added highlighting different modalities, courses or teachers to test various parameters by isolating the variables.)
Teacher — This project was limited to students but in a future project we will also measure one teacher to see what he/she feels during the same time period.
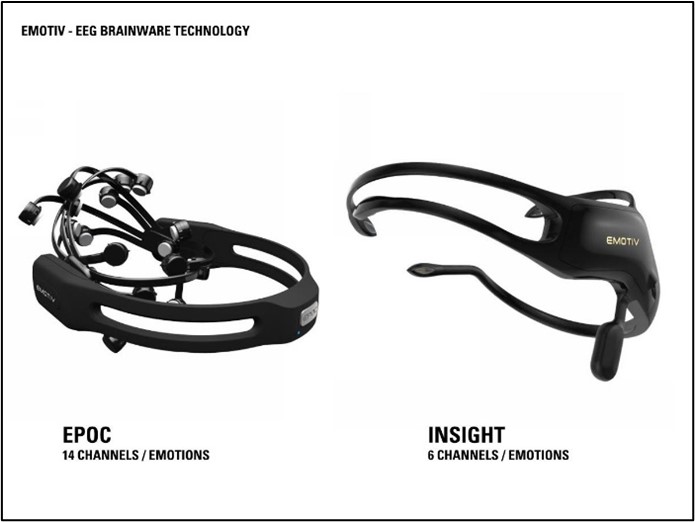
Devices — Students wore an Emotiv Brainware Device (6 Emotions being recorded simultaneously). A Go-Pro Camera recorded what the students were doing at the time of the learning experience. We were interested in learning if there would be a correlation in any spikes or dips in recorded emotions with what was happening at a given moment.)
Exit Interviews and Surveys — Students took a 16 Personalities Test so we could understand what type of personality they have and if there was any correlation between personality, emotion, Learning Experience and Learning Space.
The following images show measurements during the various data collection moments and some of the observations made:
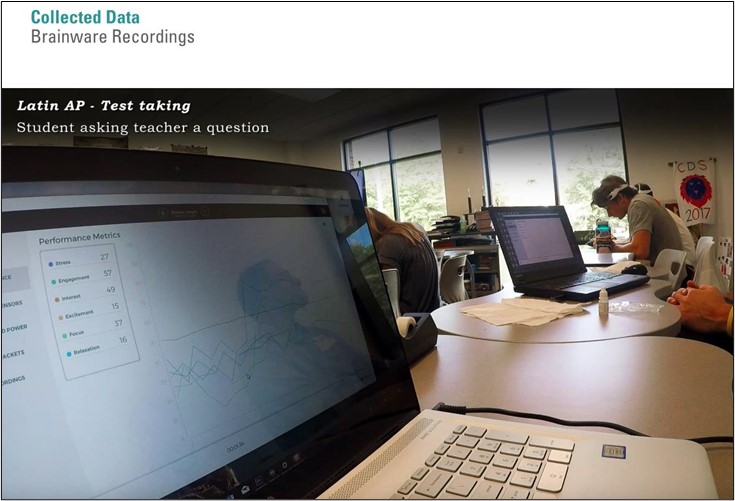
During this test-taking experience, this student’s measurements included and Engagement score of 57 out of 100 (100 being maximum engagement); and Relaxation of 16.
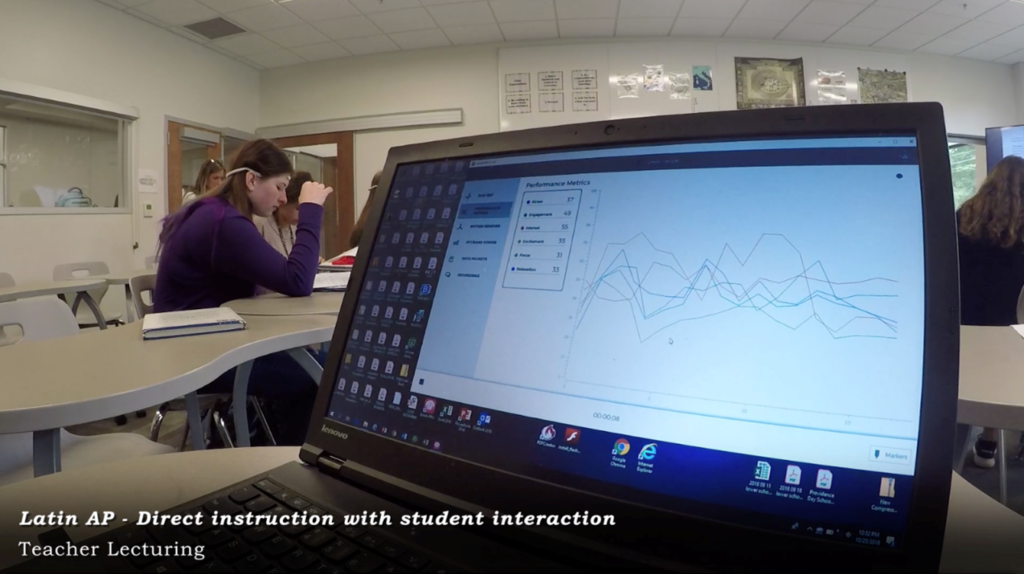
During this direct instruction experience, this student’s measurements included and Engagement score of 49, Interest of 55 and Excitement of 35.
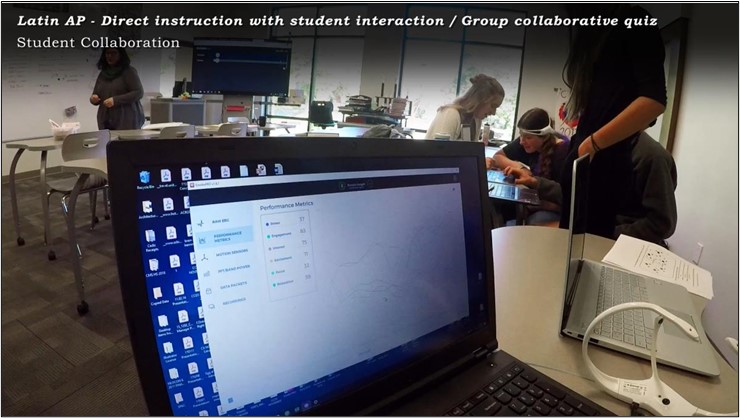
Yet, during this group collaborative quiz active learning experience in the same class, towards the latter part of the period, this student’s measurements included and Engagement score of 83, Interest score of 75 and Excitement of 71.
Her scores stayed consistently much more elevated in the group collaborative quiz segment of the class (last 15 minutes) than during the direct instruction part of the class (first 45 minutes).
Could we infer from analyzing that data that this student is more engaged and excited to do group work than listen to direct instruction consistently? Maybe. This information does not mean that all this student should do is work on group collaboration, but maybe it means that she performs better, and that modality is better for her.
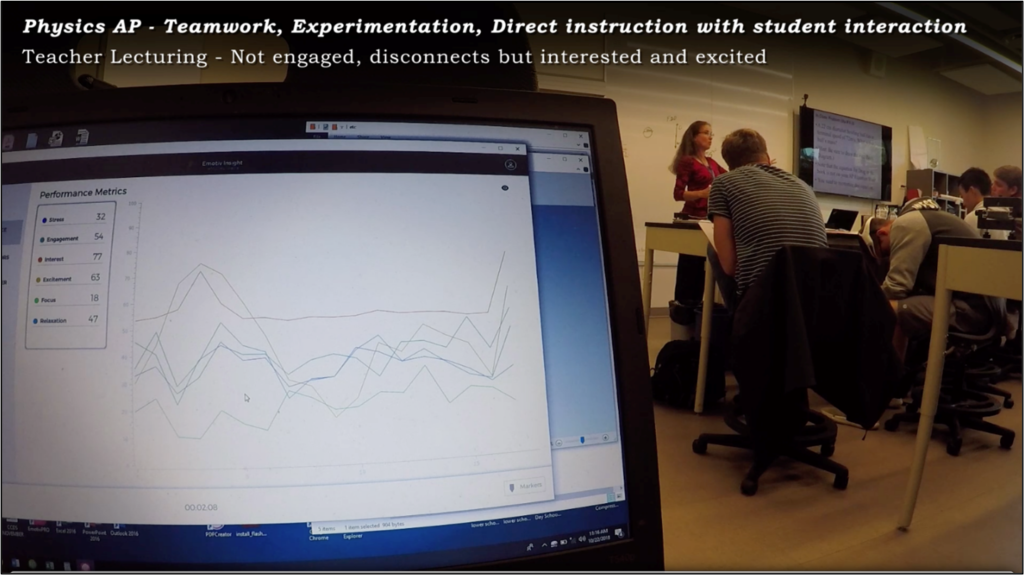
During this Teacher Lecture passive experience, this student’s measurements included and Engagement score of 39, Interest score of 53 and Excitement of 28.
But when his posturing seems to imply that his disengagement is actually increasing (Head down looking at the floor while teacher is lecturing) it is actually the opposite. His Brain measures higher levels of Engagement 54, Interest 77, and Excitement 63.
What is so incredibly interesting about this comparison is that many teachers would assume that a student that is looking down at the floor, elbows on his knees, crouched over would clearly imply that this student was unengaged. The beauty of this observation is that this specific student does that to ‘process’ what the teacher was saying, and possibly expand and connect in his mind to the implications of the content he just heard. The teacher later informed that the he is one of the top students in the class. The Brainware device allowed us a peak into the happenings in his brain. This information gives us 2 very important observations: first, that body posture does not imply engagement, and second that next time teachers look at this student they can understand him based on who he is and how he acts, a first step towards customization and differentiation.
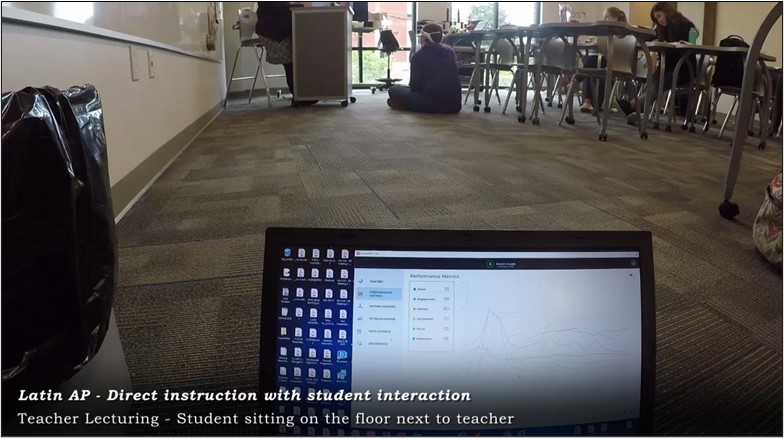
During this direct instruction experience, this student was allowed to sit on the floor after sitting on her desk for half of the class. She asked the teacher if she could sit on the floor next to her as she liked that better. Measurements, while being there were fairly consistent and included and Engagement score of 50, Interest of 60 and Excitement of 20.
Yet, during this direct instruction, the teacher made a joke that everyone laughed. Measurements included and Engagement score of 75, Interest score of 71. Could we deduct that humor makes for a more engaging experience? What if we knew it did? Would we incorporate more humor into instruction? Should teachers learn how to be better storytellers and humorists?
These are the kinds of follow up questions this project generated. We understand how these observations provide us insights, but they are not truths. At least not yet. We did learn a few things through this project.
KEY TAKEAWAYS
Personalization truly needs to start by getting personal: Understand the ‘type’ of student. (what is their Personality type, strengths, weaknesses, interests, Fears, stressors. There are patterns of engagement based on the type of Student
Interactions with teachers consistently increase Engagement: There are patterns of higher interest when students Engage in conversation with teachers or even other students, and when teachers use storytelling and humor that engagement increases
Engagement seems to consistently decline during Lecture modality and conversely Engagement seems to increase during group activities
Excitement seems to increase during group work modality. Students Active collaborative learning experiences consistently showed higher levels of Excitement
Stress (or reduction thereof) seems to be strongly correlated to school culture. This school’s culture is one of transparency, respect and fun. You can feel the ‘vibe’ there, where relationships are happening, where teachers know all students, where the small size classes help create more intimate learning experiences. They even use songs from movie soundtracks (think Superman, Mission impossible, Star Wars) during class exchanges. Always unexpected, funny, and light supporting this culture of low stress regardless of activity while supporting Attention Restoration Therapy.
NEXT STEPS
So, what next? We started to explore the data collected in Power BI, a robust software that can analyze all the data and graph it and quantify it.
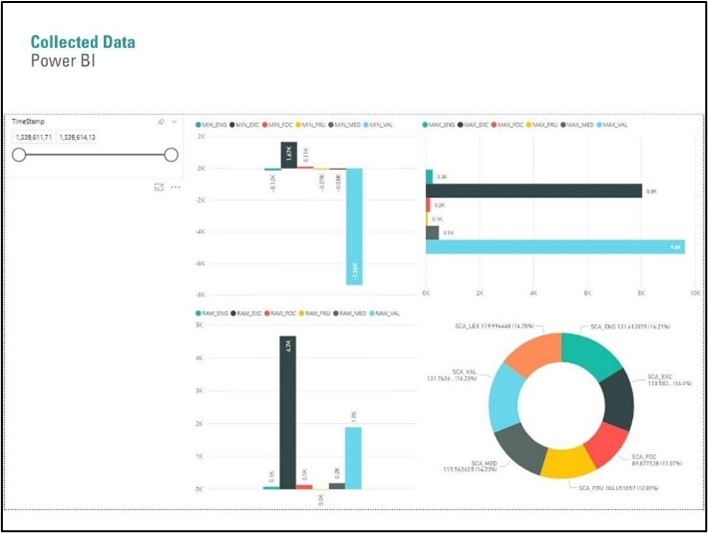
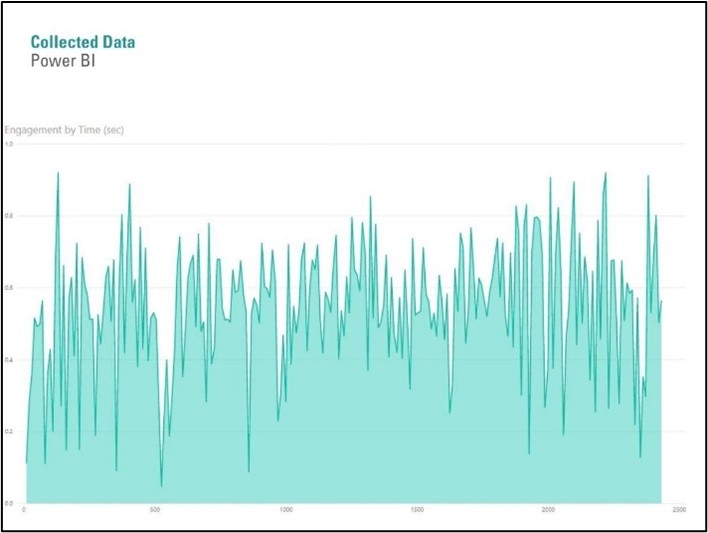
As seen in the chart above, if we correlated the graph with the video recorded on the go-pro camera we would be able to determine the moments when engagement peaked and when it was at its lowest. What was happening then? Could there be patterns observed? Why? Was there a correlation to the environment where the results happened?
Our next steps lead us to try to answer these questions:
1. How do similar tasks compare of under the various Typologies of the Immersive Learningscape?
2. 3 simultaneous readings at the same Time, Environment, and Activity. Any correlations?
3. Change daylighting while performing the same Activities. Are there perceivable changes?
4. Isolate variables. Does that affect their 6 Cognitive states?
5. Is there a correlation between personality type and how their brains respond to a certain Activity, a certain space?
All these are the questions that we want to investigate in our BrainSensing Research Project 2.0. The repercussions and insights from these future studies could provide us with unbelievable findings that could help us better understand how to better understand students, how they learn best, how they perform best, what engages them the most, a specific modality, a certain environment?
As we provoke those involved in crafting the Learning Experience (Educators, Administrators, Psychologists, Curriculum Leaders, Designers of learning environments, etc.) to think about the future of learning, it is undeniable that addressing a customized educational experience for each and every child must be a top priority and understanding the idiosyncrasies of each of their brains must be a priority in that process.